.svg)
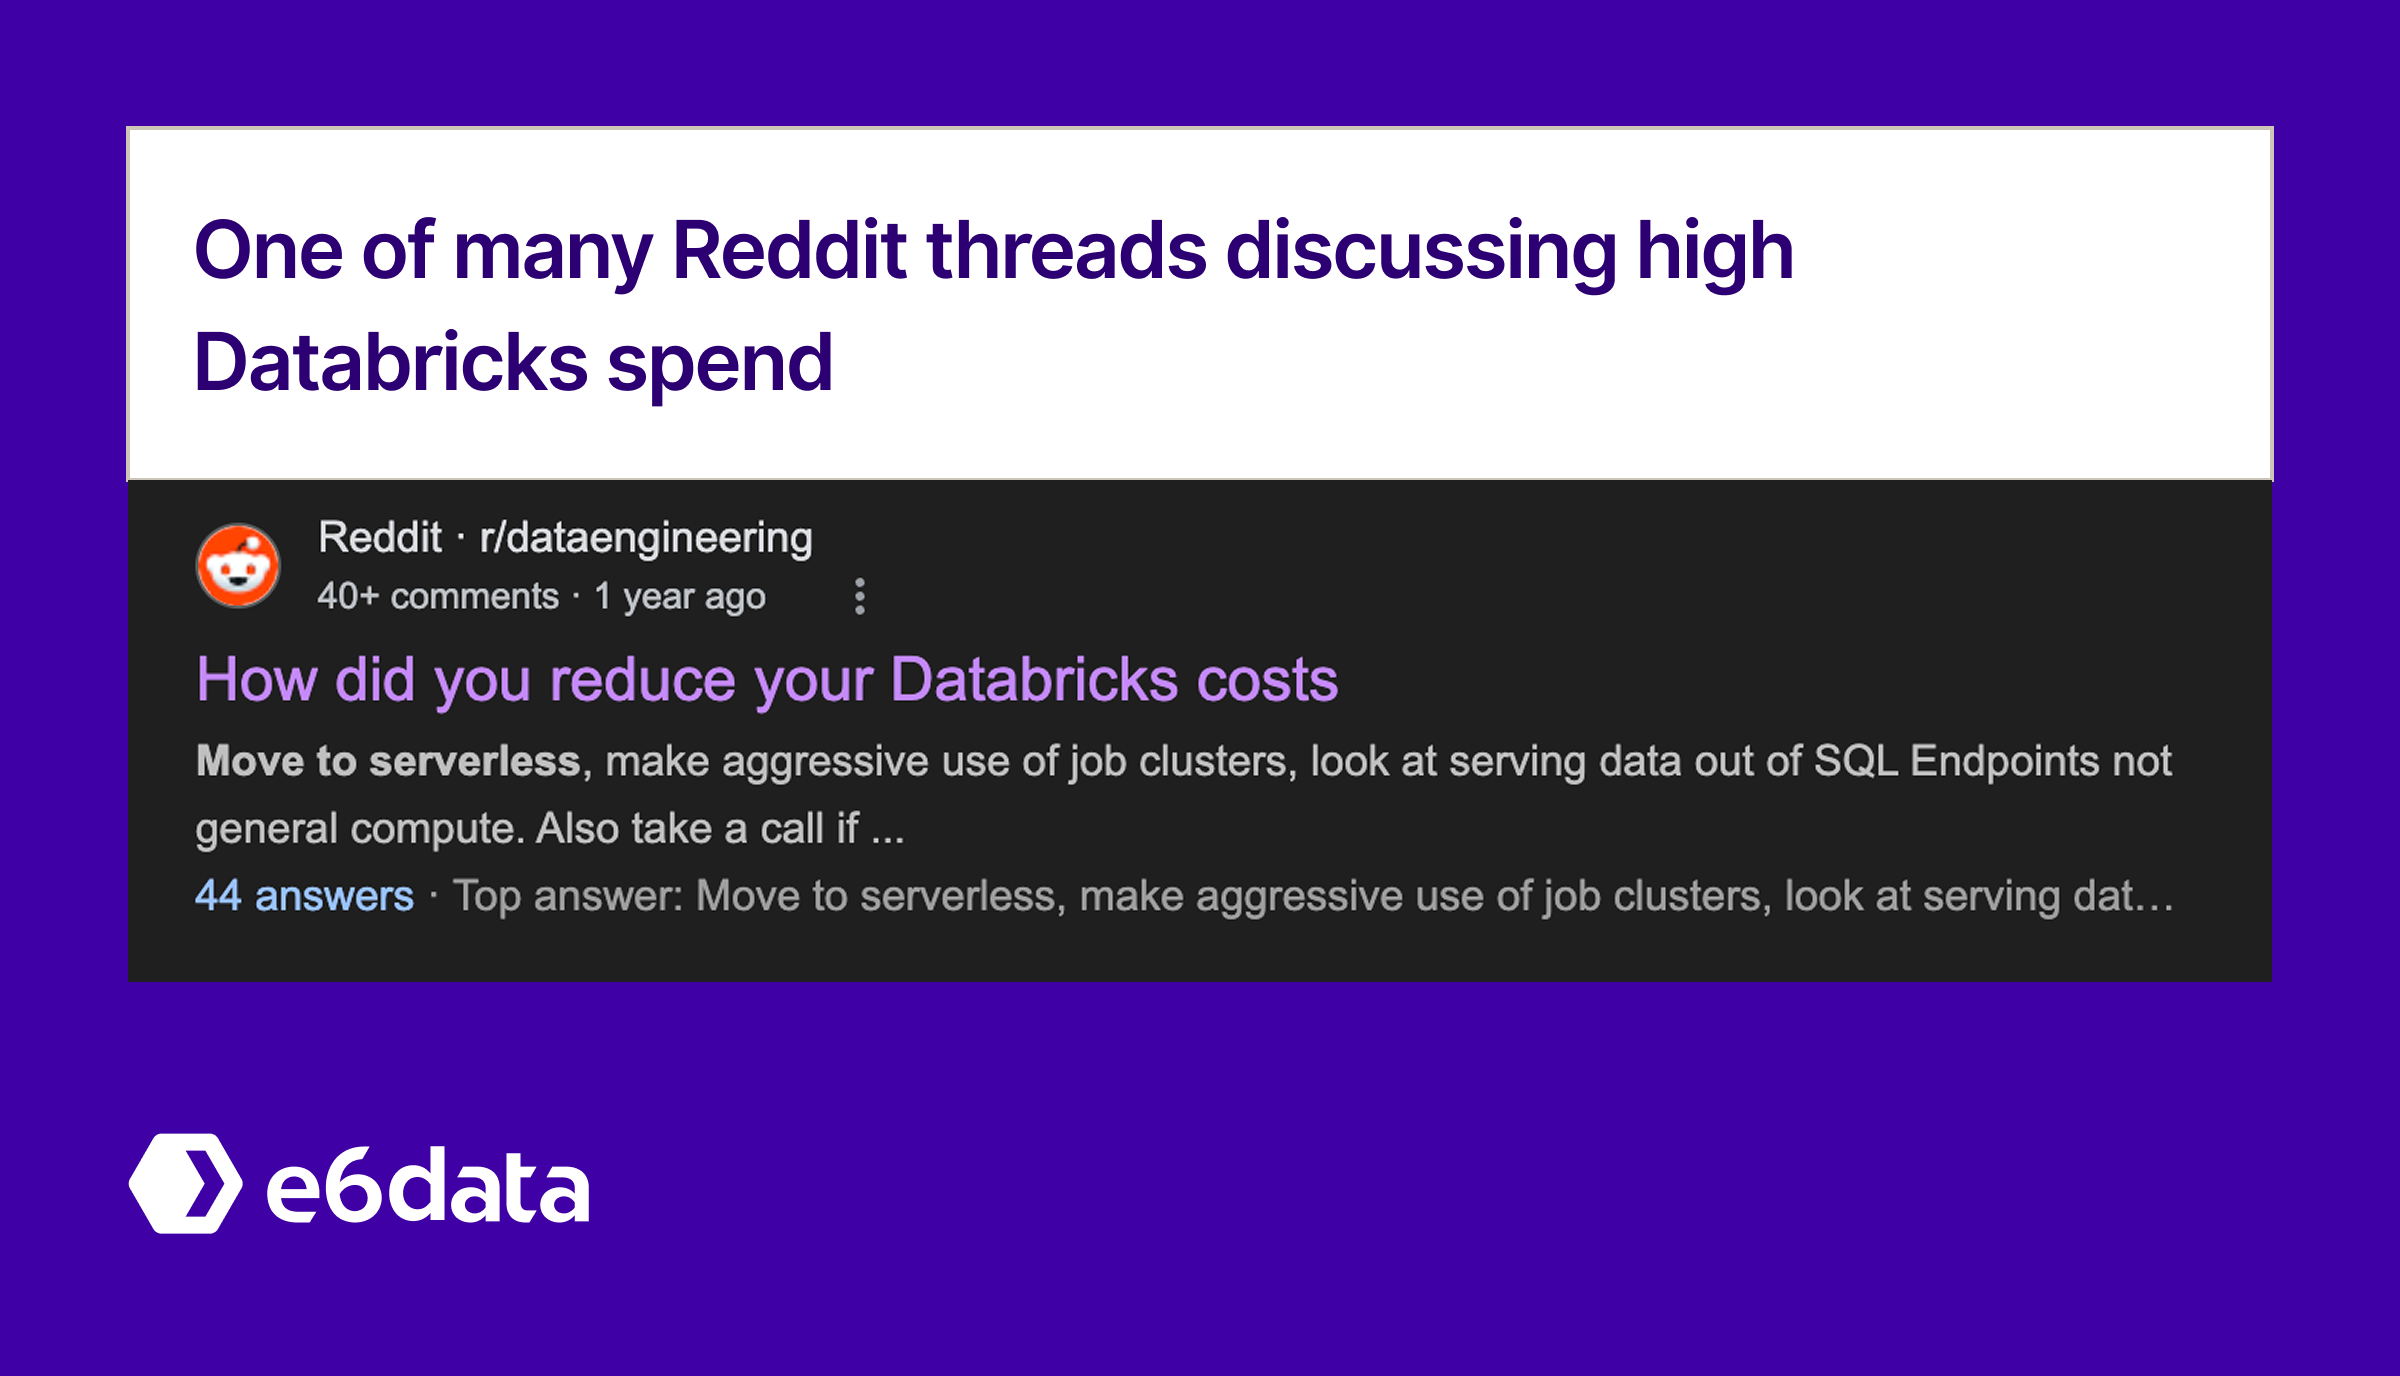
Most teams don’t “lose control” of Databricks costs in a single bad decision. Costs creep up slowly, almost invisibly, as reasonable defaults persist, temporary exceptions become permanent, and ownership diffuses across teams.
The irony is that most teams are doing cost optimization. Auto-scaling is on or some clusters auto-terminate. Photon might even be enabled in places. And yet, the bill keeps growing faster than data volume or business impact.
That’s because not all optimizations matter equally and some only work up to a point.
This guide isn’t a dump of tuning tricks. It focuses on the few decisions that actually prevent unnecessary DBU spend from becoming the default again, and on the limits you eventually hit even when you do everything “right.”
You’ll see:
The techniques below are organized by leverage, not by feature or workload. Each section explains:
Where teams commonly get stuck on specific workloads BI, ad-hoc analytics, ETL, or streaming we include concrete configs and code. Not because tuning alone solves the problem, but because partial fixes are where most cost drift starts.
The guide also covers how to navigate past the structural ceiling teams hit once governance and tuning are no longer the bottleneck.
High leverage, low effort
Think of these as hygiene controls. Most teams know about these settings. Very few enforce them consistently.
(Auto-termination + job clusters)
This is the most basic and yet the most important one.
Idle compute is the single biggest source of Databricks waste. Not because teams are reckless, but because clusters are easy to start and inconvenient to shut down. A cluster left running overnight doesn’t feel expensive in the moment. Multiply that behavior across teams and weeks, and it quietly dominates the bill.
Clusters don’t cost money because they’re doing work, instead, they cost money because they’re alive.
You see the same patterns almost everywhere:
Each decision is defensible in isolation. Together, they create a baseline of always-on compute that no one feels directly responsible for.
Cost control improves dramatically once teams make two defaults non-negotiable:
This isn’t about trusting people to remember. It’s about removing the choice entirely.
Production jobs should spin up, run, and disappear. Human-driven compute should be small, short-lived, and unapologetically disposable.
Teams that get this right rely on guardrails:
For ad-hoc analytics, it means interactive clusters that shut down quickly and restart cheaply. For BI workloads, this usually means SQL warehouses with aggressive auto-stop.
For example, here’s a JSON config for a warehouse that starts at 1 cluster and can scale up to 8 clusters, with a 10-minute auto-stop (meaning if no queries run for 10 min, it shuts down):
{
  "name": "bi_warehouse_smart_scaling",
  "cluster_size": "Small",
  "min_num_clusters": 1,
  "max_num_clusters": 8,
  "auto_stop_mins": 10,
  "scaling_policy": {
    "target_utilization": 70,
    "scale_out_threshold": 80,
    "scale_in_threshold": 30,
    "scale_out_cooldown": "2m",
    "scale_in_cooldown": "5m"
  }
}
You’ll see it clearly in usage patterns:
If your costs don’t change after this, that’s actually a good sign—it means your waste lives elsewhere. Which brings us to the next fix.
Performance improvements are cost controls
Many teams treat runtime upgrades as a risk management exercise. In reality, they’re a cost optimization lever.
Older runtimes not only miss features but also execute the same work less efficiently. That inefficiency shows up directly as higher DBU consumption.
In other words: slow compute is expensive compute.
The blockers here are rarely technical:
As a result, clusters quietly run on outdated runtimes long after better options exist and teams pay for this lack of upgradation every day.
Mature teams shift responsibility away from individual users:
For SQL-heavy workloads, Photon should be the default, not an experiment. For ETL and Spark jobs, modern runtimes with Adaptive Query Execution enabled remove a surprising amount of wasted work.
A job that runs 30% faster doesn’t just finish sooner, it consumes fewer DBUs. Across thousands of runs, that compounds into real money.
What’s more, faster execution reduces the temptation to oversize clusters “just to be safe,” which prevents a second-order cost problem from forming.
The signals are straightforward:
If runtime upgrades feel painful, that’s usually a sign they’ve been postponed too long. Once they’re routine, they stop being a discussion and start being a background control.
These fixes reset bad defaults. They don’t address:
Teams that stop here usually ask:
“We’ve enabled autoscaling and auto-termination—why is the bill still high?”
At that point, the issue isn’t configuration. It’s usage.
Where most long-term waste is created with bad practices
This is where Databricks costs quietly drift over time not because the team is careless, but because workloads evolve faster than the infrastructure decisions around them. A cluster that made sense six months ago becomes a bad fit. A temporary analysis turns into a permanent dashboard. A one-off ETL job becomes a daily pipeline.
None of these changes feel like cost events. Collectively, they are.
Most Databricks environments suffer because clusters are sized once and then reused everywhere long after the original context is gone.
The result is a platform full of “safe” defaults that are quietly expensive.
You’ll recognize these patterns:
Right-sizing only works when teams stop thinking in terms of clusters and start thinking in terms of workload characteristics.
For example, here’s a simple Python function that suggests a cluster size based on operation type and data size:
def recommend_cluster_size(operation_type, data_size_gb):
    templates = {
        "profiling": {"cores": 8, "memory": "32g"},
        "feature_engineering": {"cores": 16, "memory": "64g"},
        "model_training": {"cores": 32, "memory": "128g"},
        "large_join": {"cores": 64, "memory": "256g"}
    }
    config = templates.get(operation_type, templates["feature_engineering"])
    if data_size_gb > 100:
        # Scale up if data is very large
        config = {
            "cores": config["cores"] * 2,
            "memory": f"{int(config['memory'][:-1]) * 2}g"
        }
    return config
At a high level:
Treating them the same guarantees over-provisioning somewhere.
BI dashboards
Dashboards are predictable in one way and unpredictable in another. Queries are often similar, but usage spikes and drops throughout the day.
Cost problems usually come from:
Teams fix this by:
{
"min_num_clusters": 1,
"max_num_clusters": 8,
"auto_stop_mins": 10
}
You might accept a brief cold-start in the morning in exchange for not paying for an 8-node warehouse all night. That trade-off almost always makes sense.
Ad-hoc analytics
Ad-hoc work is where human behavior creates the most waste.
People keep clusters running because startup takes too long. They oversize clusters because they might “need it later.” They scan entire tables because it’s easier than thinking about samples.
Teams that control this:
Progressive Sampling: Start with a small sample, iterate, and only scan the whole dataset when you’re confident you need to.
Databricks (via Spark SQL) supports SQL sampling and limiting. For example:
-- Create a 1% sample table for quick exploration
CREATE OR REPLACE TABLE customer_events_sample_1pct AS
SELECT *
FROM customer_events
TABLESAMPLE (1 PERCENT) REPEATABLE(42);

-- Create a 10% sample for more in-depth testing
CREATE OR REPLACE TABLE customer_events_sample_10pct AS
SELECT *
FROM customer_events
TABLESAMPLE (10 PERCENT) REPEATABLE(42);
Here we took customer_events and made two smaller tables: one with 1% of data, one with 10%. We used REPEATABLE(42) so the sample is deterministic (same 1% each time, for consistency). Now an analyst can first run queries on customer_events_sample_1pc. If results look promising or need more data, move to 10%. Only if absolutely needed, run on the full customer_events. Often this process finds issues or answers questions without ever touching the full set until the final step.
The goal isn’t to slow people down, it’s to remove the incentive to keep expensive compute alive “just in case.”
ETL and streaming pipelines
ETL pipelines often look efficient on paper and wasteful in practice.
The common mistake is running an entire pipeline: ingestion, transformation, aggregation on a single fixed cluster sized for the heaviest stage. The lighter stages inherit that cost even when they don’t need it.
More mature setups:
For incremental workloads, techniques like Delta Change Data Feed can remove enormous amounts of unnecessary compute by processing only what changed instead of reprocessing everything.
By enabling CDF on a Delta table, you can query the changes that happened since a certain version or timestamp. Here’s how you turn it on:
ALTER TABLE transactions
SET TBLPROPERTIES (delta.enableChangeDataFeed = true);
Now, suppose you have a pipeline that updates a target table based on a source Delta table (transactions). Instead of reading the whole source, you can just read the CDF:
from delta.tables import DeltaTable

def incremental_etl_pipeline(source_table, target_table):
    # Get last processed version from a checkpoint tracking table
    last_proc_version = spark.sql(f"SELECT last_processed_version FROM etl_checkpoint WHERE table_name = '{source_table}'").collect()
    start_version = (last_proc_version[0]['last_processed_version'] + 1) if last_proc_version else 0

    # Read changes since last processed version
    changes_df = (spark.read.format("delta")
                   .option("readChangeData", "true")
                   .option("startingVersion", start_version)
                   .table(source_table))

    # Filter to only inserts/updates (ignore deletes or handle them accordingly)
    from pyspark.sql.functions import col
    new_or_updated = changes_df.filter(col("_change_type").isin(["insert", "update"]))

    # Merge into target table (upsert logic)
    DeltaTable.forName(spark, target_table).alias("t") \
      .merge(new_or_updated.alias("c"), "t.id = c.id") \
      .whenMatchedUpdateAll() \
      .whenNotMatchedInsertAll() \
      .execute()

    # Update checkpoint
    latest_version = spark.sql(f"DESCRIBE HISTORY {source_table} LIMIT 1").collect()[0]["version"]
    spark.sql(f"MERGE INTO etl_checkpoint USING (SELECT '{source_table}' AS table_name, {latest_version} AS last_processed_version) src ON etl_checkpoint.table_name = src.table_name WHEN MATCHED THEN UPDATE SET last_processed_version = src.last_processed_version WHEN NOT MATCHED THEN INSERT *")
The above is a bit involved, but the gist is:
The payoff is massive: if only 5% of rows changed since last run, you’re now processing 5% of the data instead of 100%. That’s an instant ~95% savings in compute, more or less. Even if 20% changed, that’s 80% less to process.
If only 5–10% of data changes between runs, processing 100% every time isn’t cost efficient.
You don’t need perfect utilization to know this is effective. Look for directional signals:
This is one of the most important mental shifts in Databricks cost control.
Humans are bursty, exploratory, and forgetful. Jobs are predictable, repeatable, and schedulable. Treating them the same is a structural mistake.
In many environments:
From a cost perspective, this is the worst of both worlds: expensive compute doing unpredictable work.
Cost-stable platforms draw a hard line:
This isn’t about limiting productivity. It’s about matching resources to behavior.
The most effective controls are boring and strict:
For exploratory analysis, teams also:
These controls don’t eliminate waste entirely but they cap how bad it can get.
The signals are unmistakable:
Bucket B requires harder conversations:
But this is also where the biggest, most durable savings come from.
And once these workload decisions are in place, another pattern emerges: even well-governed, well-sized environments still pay for idle capacity.
The part almost no one operationalizes
By the time teams reach this stage, they usually feel like they’ve “done the right things.” And yet, a few months later, costs are creeping up again.
This isn’t because earlier work failed. It’s because Databricks environments are dynamic by default. New jobs get added. Query patterns change. Data grows. Someone ships a fix under pressure and forgets to revisit it.
Without governance, cost optimization slowly decays.
Bucket C exists to answer a simple question: What happens when something changes?
Most Databricks environments already have cost dashboards. Very few have cost accountability.
Seeing the bill doesn’t change behavior. Knowing that you own a portion of it does.
Cost visibility often breaks down in predictable ways:
When no one owns a number, no one feels responsible for explaining it.
Cost visibility only works when it’s tied to ownership.
That means:
The moment teams are expected to explain their trends, behavior changes.
Instead of staring at monthly totals, mature teams watch signals that point to waste:
These are diagnostics that help trigger the right questions
The mechanics are simple but non-negotiable:
When costs spike, the question should be “what changed in this workload?”
Most cost spikes aren’t accidents. They’re regressions.
A new dashboard refreshes too often. A job starts processing more data. A cluster policy gets loosened for a “temporary” fix. Nothing breaks, so nothing gets rolled back.
Until the bill shows up.
Teams rely on:
By the time anyone notices, the cost has already been paid.
Mature teams treat cost regressions like production issues.
That means:
The goal isn’t zero variance. It’s fast detection.
Instead of alerts that say “you spent $X today”, teams alert on:
When something triggers, someone owns the follow-up, now
Why this matters more than it sounds
Most regressions are oversights. If you catch them early:
If you catch them late:
Buckets A and B are about fixing today’s problems. Bucket C is about preventing tomorrow’s.
Without governance, even well-designed environments slowly revert to expensive defaults.
And once governance is in place, something interesting happens:
teams realize that even with perfect hygiene, there’s still a floor they can’t break through.
At that point, costs aren’t driven by misconfiguration or behavior. They’re driven by how compute itself is allocated.
That’s where the conversation shifts from “what did we do wrong?” to “is this execution model still the right fit?”
If you’ve implemented everything so far—tight defaults, workload-aware sizing, and continuous governance—and your Databricks bill is still growing, it’s usually not because something is misconfigured.
It’s because of how compute is allocated.
Databricks (like most cluster-based systems) scales in node-sized steps. Even with autoscaling, capacity is added and removed in coarse units—entire VMs at a time. That means you routinely pay for idle CPU and memory during:
At this stage, further tuning produces diminishing returns. You can make clusters slightly smaller or faster, but you can’t eliminate the structural over-allocation built into the execution model.
That’s the ceiling most mature teams eventually hit.
Even with autoscaling enabled, clusters still grow and shrink by adding or removing entire VMs. That model made sense when workloads were mostly batch-heavy, long-running, and predictable. It starts to show cracks with today’s mix of interactive BI, ad-hoc analysis, and bursty analytics traffic.
This is where modern open lakehouse compute engines like E6data start to change the economics, not by replacing Databricks, but by changing how compute is consumed.
Atomic scaling is compute scaling at the vCPU level, not the node level. In e6data, atomic scaling is possible because analytics execution is broken into independent microservices that scale at the vCPU level through standard APIs, instead of being bundled into node-sized clusters.
Instead of:
The engine:
This matters because most analytical workloads don’t need full nodes most of the time. They need just enough compute, right now, and then nothing a few seconds later.
Traditional cluster-based scaling over-allocates by design. You size for peaks, tolerate idle time, and accept waste as the cost of predictability.
Atomic scaling removes that structural inefficiency.
In practice, teams see:
This isn’t a replacement for Databricks hygiene. It’s what comes after it.
Think of the progression like this:
Once you’ve already captured the typical 15–20% savings from tuning, right-sizing, and governance, compute granularity becomes the next ceiling on efficiency.
If you witness signs like -
Then in these environments, you’re no longer paying for work being done. You’re paying for capacity held in reserve because compute can only scale in large, node-sized steps.
That’s the point where the execution model, not tuning, becomes the dominant cost driver.
For Databricks users already committed to open formats and decoupled storage, e6data fits cleanly into the architecture:
For teams already using Databricks with open lakehouse storage, e6data fits naturally because it changes how analytics are executed, not how data is stored, accessed, or governed.
Right-sizing clusters, enforcing auto-termination, separating workloads, and adding cost governance all matter. They remove waste created by bad defaults and weak ownership. Without them, nothing else works.
But once those controls are in place, a different limit shows up.
At that point, costs aren’t driven by misconfiguration—they’re driven by how compute itself scales.
Cluster-based scaling, even when well-managed, still allocates resources in coarse steps. You pay for full nodes when workloads only need fractions of them. Autoscaling reduces waste, but it can’t eliminate it.
That’s where newer execution models like atomic, vCPU-level scaling change the economics. By matching compute to demand in real time, they remove an entire class of structural inefficiency that platform controls alone can’t fix.
Want to see where atomic scaling would actually help in your Databricks environment?
Get started for free.
.svg)
.svg)
.svg)
.png)

.svg)
.svg)
.svg)
.svg)
.svg)