.svg)
.png)
Snowflake’s elastic compute and practically bottomless storage make it one of the easiest platforms to scale analytics when your business takes off. However, that same elasticity means costs can ramp up faster than expected if usage isn’t carefully managed, especially at enterprise scales.
The goal of this guide is to help you reclaim cost efficiency without throttling your users’ needs by applying lessons learned from conversations with dozens of teams using Snowflake at scale (including those with >$10M annual spend).
-> We’ll dive deep into cost optimization techniques categorized by workload type: BI dashboards, ad-hoc analytics, and ETL/data pipelines.
-> For each category, we outline the purpose of the optimization, how to implement it (with SQL configuration or code examples), alternatives to consider (including Snowflake edition-specific features), and a key takeaway.
Before we start, it is important to audit your usage and understand the gaps, and then fix them. Even though “High cost” is relative, Snowflake does give you some yardsticks to lean on:
| Scope | Rule-of-thumb threshold | Why it matters |
|---|---|---|
|
Credit price |
Standard ≈ $2, Enterprise ≈ $3, Business-Critical ≈ $4 per credit (See Pricing) | Your edition sets the exchange rate for every optimisation effort, so a 500-credit day can mean $1,000 or $3,000, depending on SKUs. |
| Warehouse size | Anything above LARGE (> 8 credits /hour /cluster) is “expensive” unless you truly need it | X-Small bills 1 credit/hour; each step doubles the cost, so 4XL hits 128 credits/hour. Leaving one running for eight hours burns $2,000-$6,000. |
| Idle ratio | >30-40% idle time in a warehouse indicates avoidable spend | Snowflake bills per-second with a 60s floor, so every suspended minute you don’t reach is wasted credit. |
| Cloud services share | Paying when cloud services credits are >10% of daily compute | Snowflake’s first 10% of cloud services billing is free; if you’re billed more, serverless features are usually running hot. |
| Query cost | Interactive query >0.1 credit (~$0.20-$0.60) is pricey; >1 credit is very expensive |
Dashboards often finish under 0.01 credit; anything 10-100x of that usually means full-table scans or huge result sets. |
| Account run rate | Burn rate outpacing committed credits by > 20 % | If your rolling 90-day average would exhaust the annual commitment early, you’re officially in “high-cost” territory. |
| Serverless features | Serverless spend (Snowpipe, materialised view, automatic clustering) > 15 % of total compute | These services are convenient but can creep; most accounts keep them in the single-digit percentages. |
With these benchmarks in mind, let’s dive into cost optimization techniques specific to different workloads.
Snowflake’s usage primarily soars when one of three job families is active:
| Workload | Typical pattern | Cost risk |
|---|---|---|
|
BI dashboards |
Predictable reads, strict latency SLOs | Paying for idle warehouses and duplicated caches |
| Ad-hoc Querying | Spiky, often messy analyst queries | Long-running scans nobody meant to run |
| ETL / pipelines | Scheduled or event-driven writes | 60-second billing floor, re-processing old data |
In this hub, every cost optimisation technique is mapped to a highlight use case and structured with implementation how-to, alternatives, and key takeaways.
Note: Auto-suspend, warehouse right-sizing, and other “virtual warehouse configuration” tips really help every workload. For the purpose of this optimisation hub, we have grouped them where the cost/benefit balance is most obvious, but you can safely apply them across ETL, ad-hoc, and BI dashboards.
Typical cost pitfalls: Paying for idle compute and running identical queries repeatedly (duplicated caching)
Many dashboards refresh on a fixed schedule (every minute, every 5 minutes, etc.). If the refresh is more frequent than the underlying data update, Snowflake ends up executing identical queries repeatedly for no new information.
For example, refreshing a dashboard every minute while its source table only updates hourly means 59 out of 60 queries do nothing but consume credits. Over a 12-hour workday, that’s ~708 redundant queries – essentially money burned with no benefit.
How to implement
Alternative:
Takeaway: Optimize the dashboard’s query frequency first; warehouse-level tuning comes second. Fewer queries not only cut costs directly, but also mean caches last longer and warehouses can stay suspended more often.
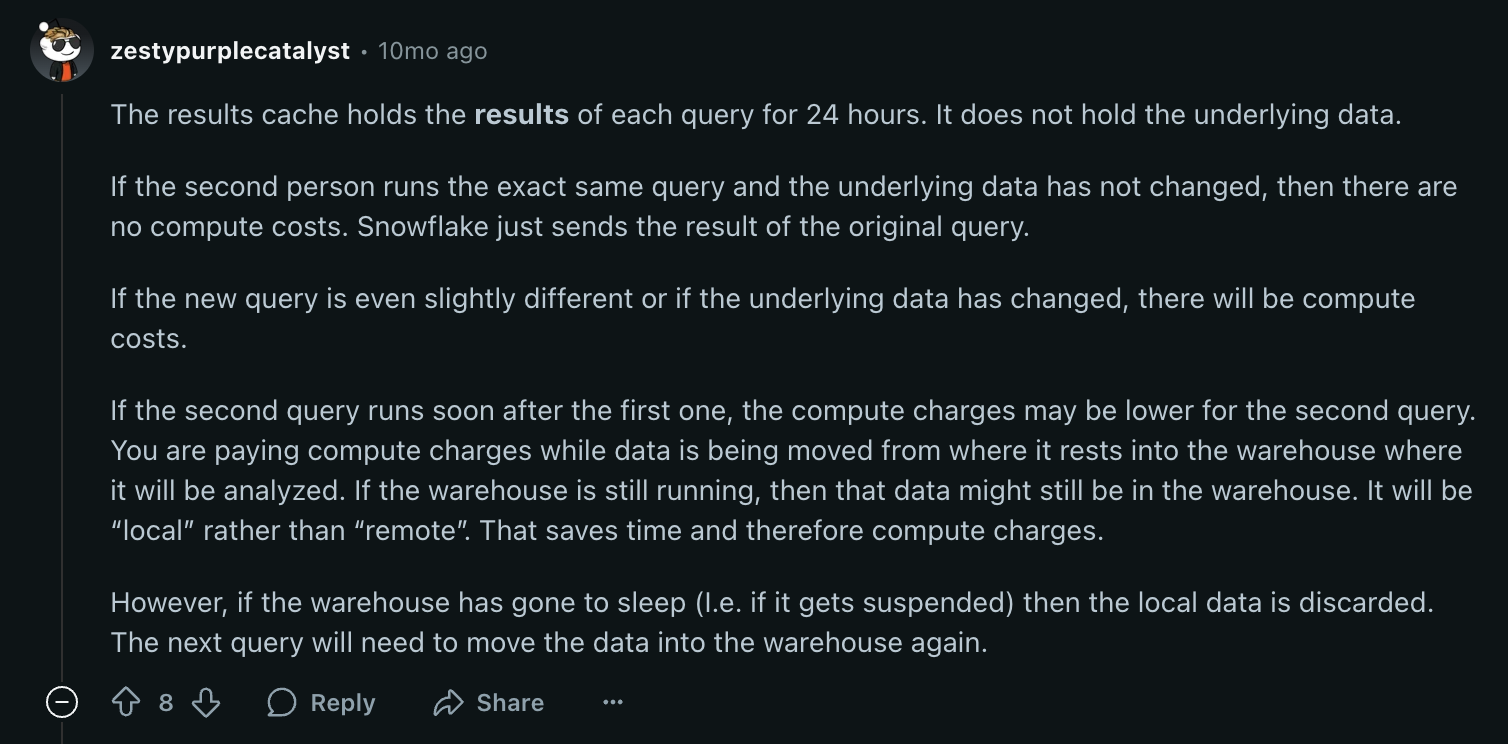
Snowflake keeps the results of any query for 24 hours. If a dashboard runs the exact same SQL during that window, Snowflake serves the answer straight from its result cache—no warehouse spin-up, no credits burned.
The catch is that both the query text and the underlying data snapshot must match. Many BI queries have nondeterministic aspects (current timestamps, rolling time windows, etc.) or simply pull “latest data” and thus miss out on result caching.
How to implement:
1. Query a frozen snapshot, not the live table
-- Create a stable slice of the data once an hour
WITH snap AS (
  SELECT *
  FROM   sales_snapshot            -- built by your ETL pipeline
  WHERE  snapshot_at = (SELECT MAX(snapshot_at) FROM sales_snapshot)
)
SELECT region, SUM(revenue)
FROM   snap
GROUP  BY region;
Because every dashboard tile now hits the same snapshot timestamp, Snowflake treats the SQL as identical and hands back the cached result for the next 24 hours.
2. Standardize the SQL text across refreshes and tools:
Ensure every instance of a given dashboard query is literally identical. Even trivial differences (extra spaces, capital letters, or different formatting) will bypass the result cache. If possible, use parameterized queries or have all your BI tools use the exact same SQL string so Snowflake can match it byte-for-byte across runs. This way, user A’s dashboard and user B’s dashboard are recognized as the same query, hitting the same cached results.
Docs: Result caching
Alternatives:
1. If your business logic changes between refreshes, or you need more granular staleness control, consider:
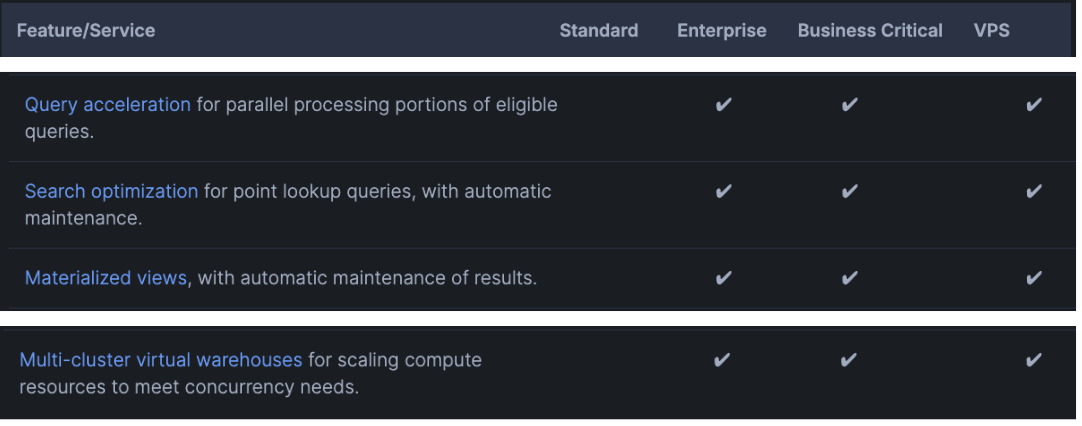
Both cost credits to maintain, but can be cheaper than rerunning complex and large queries all day. (Note: Materialized Views and Dynamic Tables are Enterprise Edition features)
2. You can also use a SQL converter, which automatically converts one SQL dialect to another without human effort.
Takeaway: Cached results are instantaneous and free – every cache hit avoids spinning up a warehouse and burning credits. Achieving this might require minor changes (querying stable snapshots or standardizing SQL), but it can drastically cut the cost of high-frequency dashboards.
When dozens of users hit the same dashboard simultaneously, the bottleneck is query concurrency. Scaling up to a larger warehouse won’t help if queries are queuing; scaling out by adding clusters will.
Snowflake’s Multi-cluster Warehouse (MCW) feature lets you increase concurrency by using multiple smaller clusters that run in parallel. For the same total credit burn, it’s often more efficient to have several small warehouses working simultaneously during a burst, rather than one big warehouse trying to handle everything sequentially.
How to implement:
ALTER WAREHOUSE BI_DASH
  SET SIZE              = 'SMALL',   -- keeps each cluster cheap
      MIN_CLUSTER_COUNT = 1,         -- idle baseline
      MAX_CLUSTER_COUNT = 3,         -- head-room for spikes
      SCALING_POLICY    = 'ECONOMY'; -- spin clusters up only when queues form
What this does
Docs: Multi-cluster warehouse
Alternative:
For example, setting QUERY_ACCELERATION_MAX_SCALE_FACTOR = 3 on a warehouse allows Snowflake to temporarily boost that warehouse with up to 3x additional compute for queries that would benefit. The warehouse can remain a single Small (saving cost most of the time), and only the rare heavy query triggers extra compute. (We’ll cover QAS in the Ad-hoc section as well.)
Takeaway: When faced with bursts of simultaneous dashboard queries, scaling out with parallel clusters tackles the issue more cost-effectively than scaling up a single cluster. You pay the same credit rate either way, but multiple small clusters can eliminate queue delays and cut idle time.
After you’ve slowed dashboard refreshes and squeezed maximum value from caches, most of a reader warehouse’s lifetime is waiting rather than working. Snowflake bills right down to the second, so each extra minute the warehouse sits idle is pure waste. Dropping AUTO_SUSPEND to 60 seconds means the meter stops almost immediately after the last query finishes, yet cold-start latency stays tolerable because queries are now infrequent and well-cached.
How to implement:
ALTER WAREHOUSE BI_DASH SET AUTO_SUSPEND = 60, -- warehouse sleeps after one idle minute AUTO_RESUME = TRUE; -- wakes automatically on the next query
What changes?
Docs: Auto-suspend virtual warehouse
Alternatives:
Takeaway: Idle seconds are silent budget killers. Once refresh cadence and caching are under control, a short suspend window turns those seconds back into savings.

Dashboards often ask the same question—“total sales by day,” “inventory on hand,” “order by ID”—again and again. When those queries hit raw fact tables, Snowflake must scan gigabytes or even terabytes every single time, racking up credits. Two built-in features prevent that treadmill:
How to set them up:
-- Repeated heavy aggregate? Create an MV.
CREATE MATERIALIZED VIEW mv_sales_by_day AS
SELECT order_date,
SUM(amount) AS rev
FROM raw_sales
GROUP BY order_date;
-- Dashboard filters on one customer or order at a time?
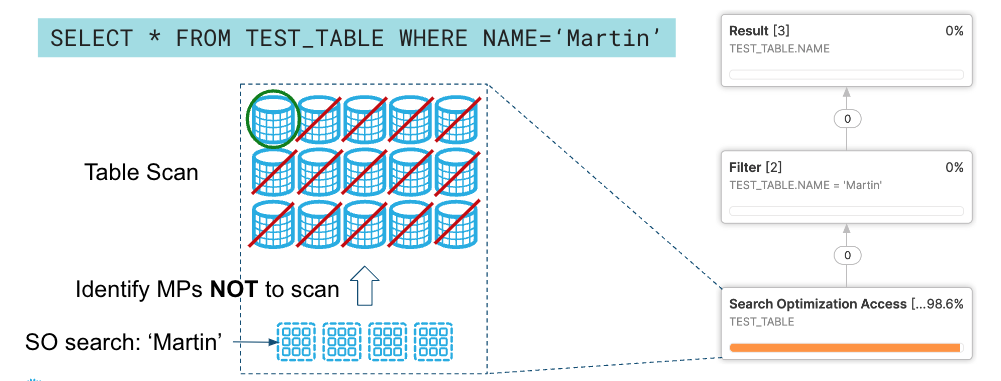
-- Add SOS so Snowflake jumps straight to the matching partitions.
ALTER TABLE big_orders ADD SEARCH OPTIMIZATION;
MVs refresh automatically—only the changed partitions are recomputed, so maintenance credits stay modest. SOS is serverless: you pay based on index size and updates, not for warehouse time.
Docs: Materialised Views, Search Optimization Service
Alternatives:
Takeaway: Pay to compute big aggregates once, then serve them cheaply (or even free, via the result cache) the rest of the day. Your dashboards stay fast, your warehouses stay small, and your credit bill stays calm.
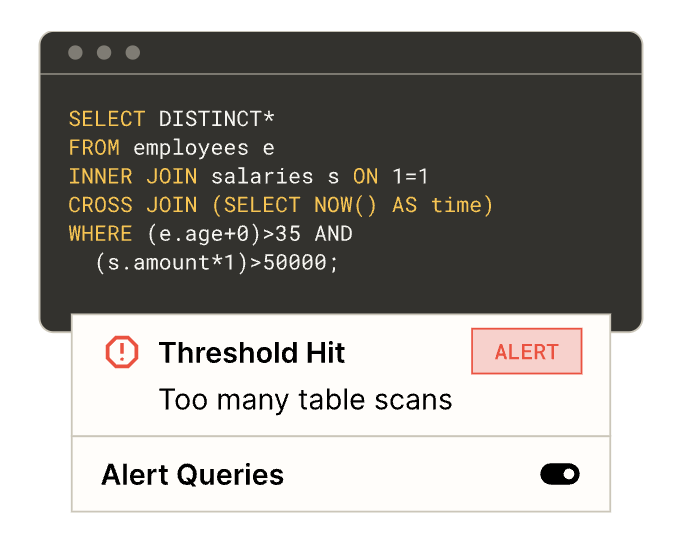
Typical cost pitfalls: Analysts running huge scans “just to peek,” or accidentally joining the entire data warehouse (runaway queries)
Analysts often want to “peek,” not scan 20 TB. A culture of TABLESAMPLE and LIMIT 1000 shrinks cost burn without slowing discovery.
How to implement:
Alternatives
1. Use Snowflake’s Preview App (beta), which shows estimated credits before a query runs. If available, enabling this “Query Preview” can be very eye-opening for users. It will display an estimated $$ or credit usage for the query, which often prompts analysts to reconsider running that 200 GB join and maybe apply a filter or sample first.
2. Another approach is to route your select ad-hoc work to a separate platform that has stricter guardrails. For example, you might spin up a smaller-sized warehouse (with a hard timeout and maybe even a resource monitor cap) for ad-hoc use – if a query is too heavy, it will simply queue or abort, preventing runaway costs.
Takeaway: Good SQL hygiene beats any warehouse tweak.
One challenge with ad-hoc workloads is sizing your warehouses: most queries might be lightweight, but a few are “monster” queries that need a lot of compute. Snowflake’s Query Acceleration Service (QAS) detects slow-moving queries and temporarily adds extra CPU behind the scenes, then releases it the moment the query finishes. Your default warehouse stays lean; burst power appears only when the SQL truly needs it.
How to implement:
ALTER WAREHOUSE ANALYST_XS
  SET QUERY_ACCELERATION_MAX_SCALE_FACTOR = 3;  -- allow up to 3x extra CPU
Docs: Query Acceleration Service
Alternatives
1. If you don’t have the Enterprise edition or choose not to use QAS, a manual approach is to let analysts temporarily resize the warehouse when needed. Temporary manual resize via ALTER SESSION SET WAREHOUSE_SIZE = 'MEDIUM' when analysts hit a wall.
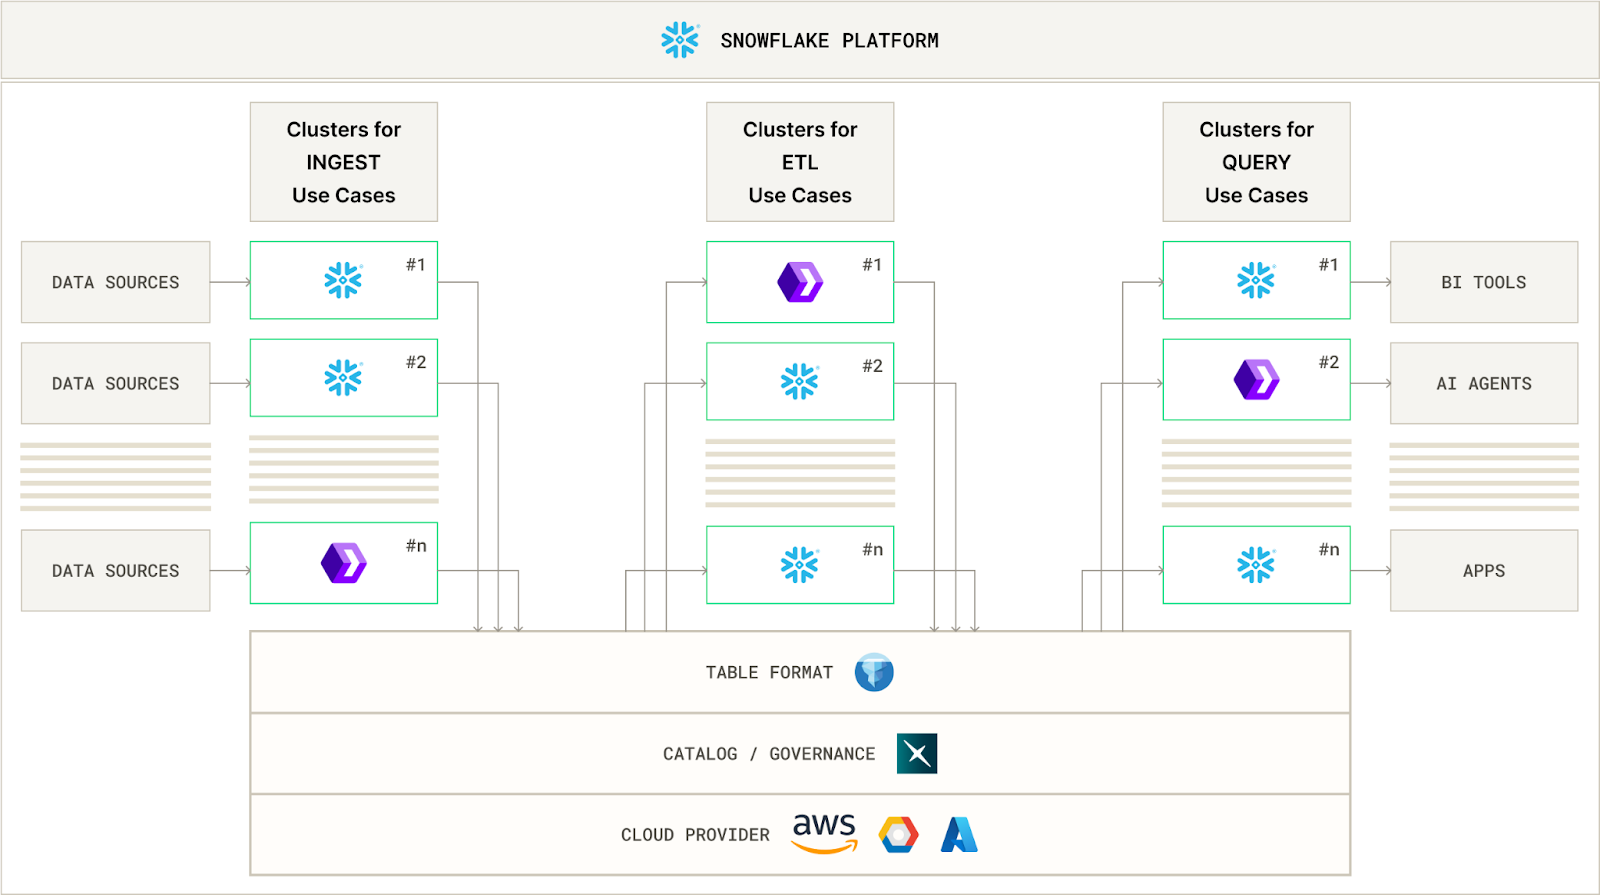
2. You can also use another SQL query engine for just the complex workloads with large table scans, like e6data, which can autoscale granularly (atomically) per vCPU to accommodate varying workloads, while charging you only for the cores consumed.
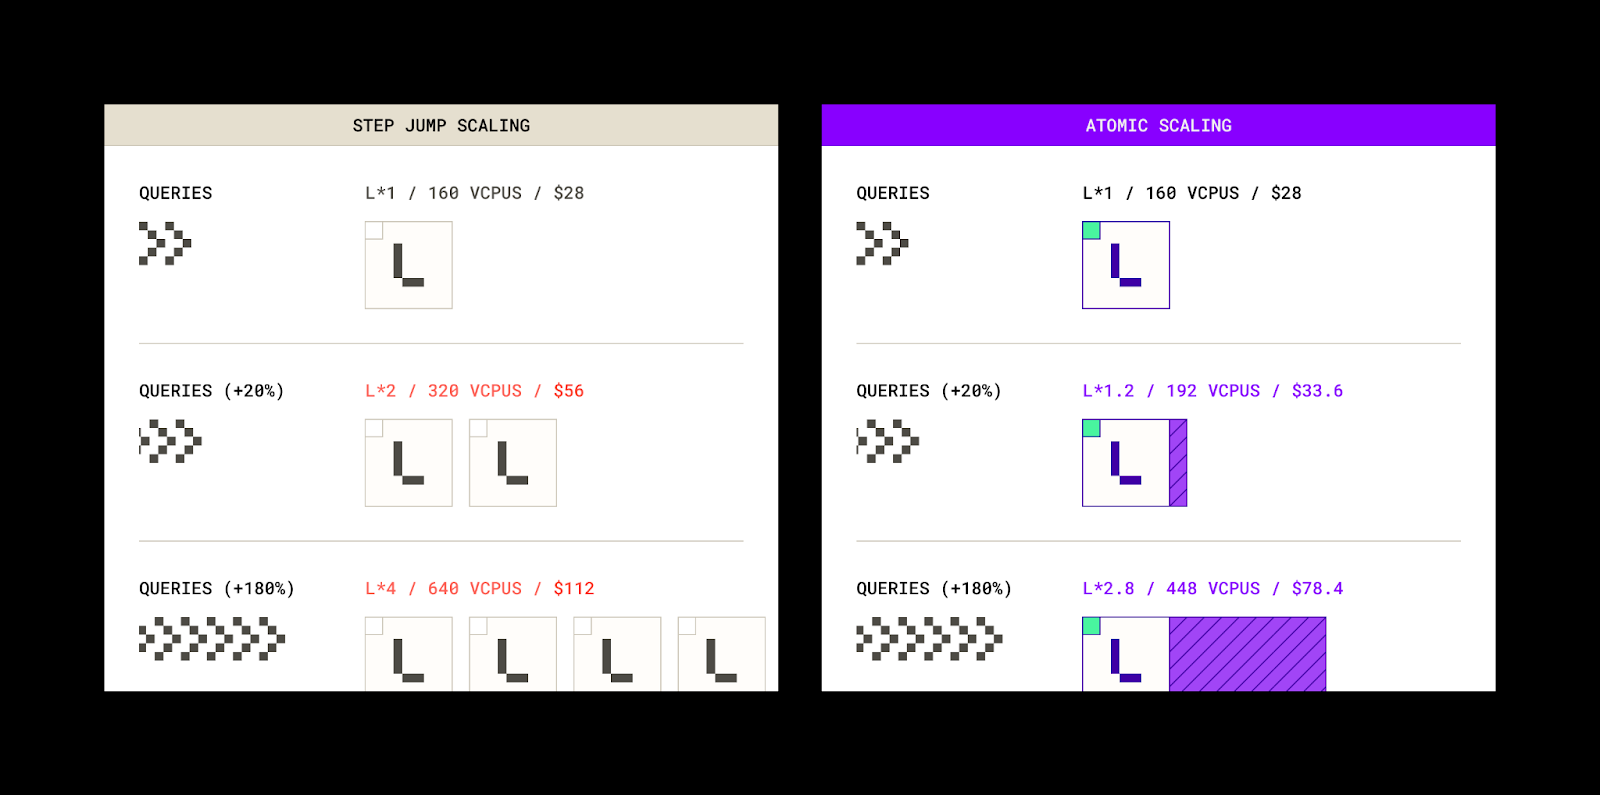
Takeaway: Let your warehouse live small and cheap. Burst compute only when the rare, truly demanding query appears—no more, no less.
Snowflake’s credit ledger is detailed, but only you can decide which costs belong to Marketing, which to Finance, and which to that side-project nobody remembers approving. By stamping each session—or even each query—with a descriptive tag, you give Finance a clean key for slicing spend by team, project, or sprint. Once the dashboards light up, waste is no longer a mystery pile of “shared” credits; it’s an itemized line that the right budget owner can fix.
How to implement:
ALTER SESSION SET QUERY_TAG = 'dept=marketing,project=campaign_x';
Alternatives
Takeaway: Transparency drives optimization. You can’t manage what you can’t measure.
An often underrated way to control costs is through access control and permissions. By restricting who can make changes to virtual warehouses or run certain workloads, you minimize the chances of someone accidentally making a modification that leads to unexpected costs. You can require that only designated admins can resize or alter warehouses, and that certain user groups are limited to smaller warehouses for their queries. This way, any major change in compute resources goes through a controlled process (or at least an approval), and heavy workloads can be isolated.
How to implement:
Use Snowflake’s role hierarchy and grants to enforce these boundaries. For example, you might create roles like WAREHOUSE_ADMIN (allowed to create/modify warehouses) and ensure analysts only have USAGE permission on pre-approved warehouses. To prevent unauthorized resizing:
-- Remove ability for analysts to modify warehouses
REVOKE MODIFY ON ACCOUNT FROM ROLE analyst_role;
-- (Grant MODIFY only to a warehouse admin role)
-- Grant usage on small warehouses to all analysts
GRANT USAGE ON WAREHOUSE shared_small_wh TO ROLE analyst_role;
-- Do not grant usage on larger warehouses to analyst_role (or revoke it if inherited)
Docs: Access Control Management
Alternatives
1. If managing granular Snowflake roles is challenging, consider implementing a query routing or approval process outside Snowflake. For example, queries above a certain size or warehouses above a certain tier could require approval via a workflow. This is more complex, so leveraging built-in roles and grants is preferable.
2. Another alternative (if organizationally feasible) is to separate workloads into different Snowflake accounts/projects with different cost centers and permissions, though that introduces data synchronization overhead. his is a heavier solution, since it introduces data replication between accounts and administrative overhead, but it absolutely walls off costs between groups.
Takeaway: By limiting who can spin up big compute or alter warehouse settings, and by guiding users to appropriate warehouses, you encourage cost-conscious behavior by design.
Snowflake allows queries to run for days by default (up to 48 hours!), which means a runaway query or forgotten join can rack up a massive bill before anyone notices. Enabling query timeouts puts a cap on how long any single query can run – and thus how many credits it can burn. If a query exceeds the timeout (say 1 hour), Snowflake will automatically cancel it.
How to implement:
Decide on an appropriate timeout based on your workload (e.g., 1 hour for ad-hoc warehouses, maybe longer for ETL warehouses if needed). Then set the STATEMENT_TIMEOUT_IN_SECONDS parameter for the warehouse or at the account level. For example, to set a 30-minute timeout on an ad-hoc warehouse:
ALTER WAREHOUSE ANALYST_WH
  SET STATEMENT_TIMEOUT_IN_SECONDS = 1800;
Docs: Parameters
Alternatives:
Takeaway: Query timeouts are a simple way to mitigate the impact of runaway queries. By default, a Snowflake query can run for 2 days(!) before cancellation, potentially costing hundreds of credits. Setting reasonable timeouts on each warehouse ensures no single query can secretly run amok.

Typical cost pitfalls: Full-table reprocessing when only a small fraction of data changed, and inefficient resource usage (e.g., many tiny jobs each incurring minimum charges)
Traditional batch ETL might rebuild a whole table every run (“full refresh”), even if only 1% of the data is new or updated. This wastes credits on scanning unchanged data and writing out duplicate results.
Snowflake’s Streams & Tasks framework enables a change-data-capture (CDC) approach: you capture only the deltas (new inserts/updates/deletes) and apply those to your target table. By processing only what’s changed since the last run, each load is dramatically lighter, faster, and cheaper than reprocessing full datasets.
How to implement:
-- 1️⃣ Create a change-data stream on the raw table
CREATE OR REPLACE STREAM stg_orders
  ON TABLE raw.orders;
-- 2️⃣ Hourly task merges the changes into the warehouse table
CREATE OR REPLACE TASK merge_orders
  WAREHOUSE = etl_wh
  SCHEDULE  = '1 HOUR'
AS
MERGE INTO dw.orders t
USING stg_orders s
ON    t.id = s.id
WHEN MATCHED THEN UPDATE
WHEN NOT MATCHED THEN INSERT;
Docs: Introduction to Streams
Alternative
1. If you need sub-second latency, switch to Snowpipe Streaming. It pushes row changes directly into Snowflake and charges per row, bypassing the 60-second minimum a warehouse task would incur. The trade-off is complexity and possibly higher cost per row for very large volumes, so Snowpipe Streaming makes sense for low-latency requirements on moderate data volumes.
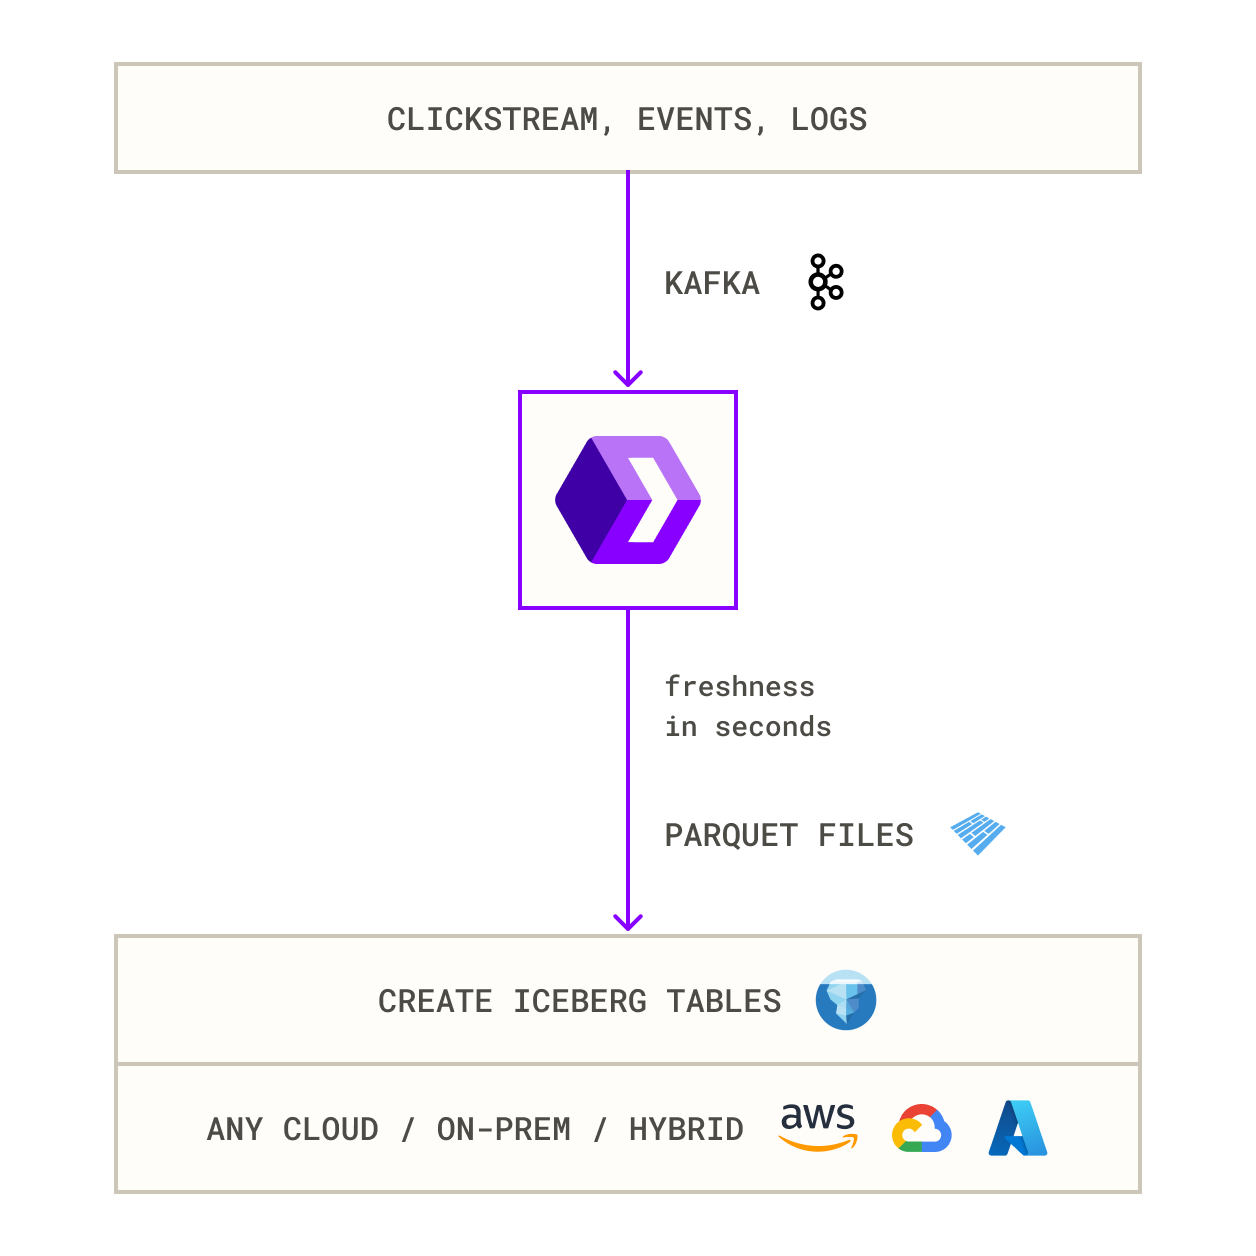
2. Use another real-time ingest engine that can directly land event streams to Iceberg tables in a queryable format in a zero-ETL fashion in less than a minute.
Takeaway: Capture changes once, merge them once, and spend credits only on data that actually arrived since the last run.
Snowflake Tasks that run on a schedule using a warehouse have a fundamental billing granularity: if a task uses a warehouse, each run is billed a minimum of 60 seconds of that warehouse, even if the SQL completes in 5 seconds. Many ETL jobs, however, especially staging or small incremental loads, finish in just a few seconds.
Snowflake’s new Serverless Tasks feature addresses this by letting tasks run without a dedicated warehouse, consuming only the compute they actually need per execution (billed per second with no base charge).
How to implement:
-- Former warehouse-based task
-- CREATE TASK stg_load WAREHOUSE = etl_wh SCHEDULE = '1 MINUTE' AS …
-- Serverless rewrite
CREATE OR REPLACE TASK stg_load
  SCHEDULE = '1 MINUTE'          -- same cadence
AS
CALL ingest_stage();             -- your stored procedure
Docs: Introduction to Tasks
Alternatives:
1. If serverless tasks are not yet available in your region or account, you can mitigate the 60-second billing overhead by batching tiny jobs together. Instead of running a task every minute, combine the logic to run, say, every 10 or 15 minutes on a small warehouse. This way each run does more work and the 60-second minimum is amortized. You’ll introduce a bit of latency (data might be 10 minutes old instead of 1 minute), but you will drastically cut the number of times you pay that minimum.
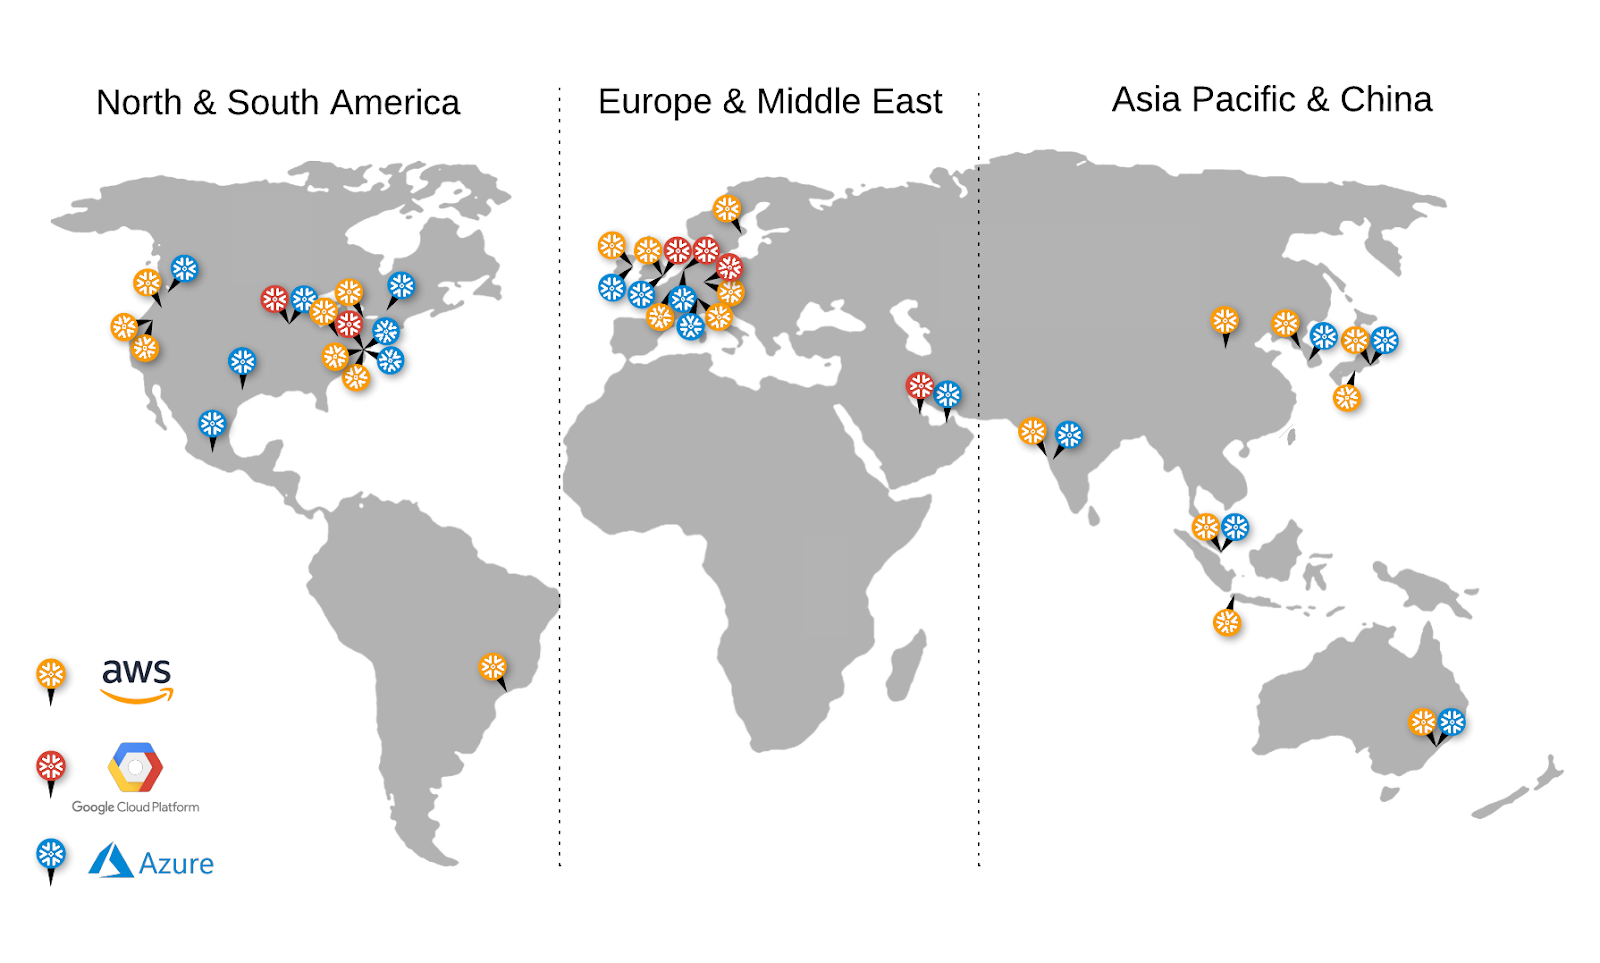
2. If serverless is not available in your region, consider extending your Snowflake’s reach through e6data’s compatible multi-region and hybrid deployment architecture.
Takeaway: For bursty workloads that run faster than the billing minimum, using serverless tasks ensures you only pay for the seconds you actually use. Even the smallest warehouse would overcharge you in those cases due to the 60-second floor. Serverless tasks are essentially “pay-per-query” and eliminate the waste for sub-minute jobs.
Snowflake tables are stored in immutable micro-partitions (~16 MB compressed each), so each time you update or delete a single record, Snowflake has to recreate the entire micro-partition that the record lives in. A single small update could rewrite hundreds of thousands of rows. Likewise, inserting a handful of rows at a time causes “small file” overhead as Snowflake tries to combine them into existing micro-partitions. Beyond the compute cost of these rewrites, frequent DML also bloats your Time Travel and Fail-safe storage, since Snowflake must retain previous versions of each modified micro-partition.
How to implement:
The remedy is to batch up small DML operations whenever possible. Instead of updating rows one by one or in very small batches, stage them and apply in bulk. For example, if you have a stream of incoming changes, accumulate them for a few minutes (or until reaching a threshold), then do a single MERGE or bulk INSERT:
-- Stage incoming small updates in a transient table
CREATE OR REPLACE TRANSIENT TABLE updates_stage AS
SELECT * FROM external_change_feed
WHERE ...;  -- e.g. all changes in the last 5 minutes
-- Apply all staged updates in one batch merge
MERGE INTO target_table t
USING updates_stage u
ON t.id = u.id
WHEN MATCHED THEN UPDATE SET ...
WHEN NOT MATCHED THEN INSERT (...);
Alternatives:
Takeaway: Don’t poke Snowflake one row at a time. Batch up small DML operations into larger transactions whenever possible. Snowflake shines when you treat data modifications in bulk – use it as the analytic database it was meant to be.
When it comes to bulk loading, file size matters for cost. Files that are too large underutilize parallelism, while too many tiny files incur extra overhead. Snowflake recommends aiming for data files in the 100–250 MB (compressed) range for optimal load performance. If you have lots of small files (e.g. thousands of 1 MB files), Snowflake has to open and commit each one, which adds latency and overhead.
In fact, if you use Snowpipe, Snowflake charges an overhead of 0.06 credits per 1,000 files loaded – so 1,000 tiny files could cost ~$0.12 in overhead even if they contain the same data as a single large file.
How to implement:
Ensure your upstream processes are bundling data into moderately sized files before they land in Snowflake’s stage. If data arrives continuously, consider buffering it and combining it into one file per minute or per hour instead of constant trickles. Many teams use cloud storage lifecycle rules or simple batching scripts to concatenate small files. Conversely, if exporting huge files, use a splitter.
For example, on Linux, you might do:
# Split a large CSV into ~100MB chunks (100k lines per file as an example)
split -l 100000 large_export.csv export_chunk_
Alternatives:
Takeaway: Aiming for file sizes ~100–250 MB compressed is a widely accepted best practice. It allows Snowflake to fully utilize parallel threads without incurring excessive per-file overhead fees. In practical terms, ten 100 MB files will load faster and cheaper than 1,000 1 MB files or one 1,000 MB file.
When only a tiny slice of your workload spills to disk or needs extra RAM/CPU, don’t scale the whole warehouse up. Instead, move those heavy-footprint queries to a separate (larger or Snowpark-optimised) warehouse so the other ~99 % of queries can keep running on a cheaper size, and you stop paying “large-warehouse” credits for everything.
How to implement:
-- Top 10 queries that spilled to local or remote storage
SELECT  query_id,
        warehouse_name,
        bytes_spilled_to_local_storage,
        bytes_spilled_to_remote_storage,
        substr(query_text, 1, 120)  AS sample_sql
FROM    snowflake.account_usage.query_history
WHERE   (bytes_spilled_to_local_storage  > 0
     OR bytes_spilled_to_remote_storage > 0)
  AND   start_time >= dateadd(day,-45,current_timestamp())
ORDER BY bytes_spilled_to_remote_storage DESC,
         bytes_spilled_to_local_storage DESC
LIMIT 10;
Provision a dedicated warehouse sized only for those queries (e.g. LARGE, or SNOWPARK-OPT, autosuspend 60 s).
CREATE WAREHOUSE IF NOT EXISTS ETL_SPILLING_WH
  WAREHOUSE_SIZE = 'LARGE'
  AUTO_SUSPEND   = 60
  AUTO_RESUME    = TRUE;
Docs: Snowflake “Queries too large to fit in memory – finding queries that spill”
Alternatives:
Takeaway: Segregate the 5% of queries that need extra muscle, so the other 95% can run on leaner resources. This ensures you pay “Large warehouse” rates only when necessary, rather than for every single small transform. It’s a form of workload isolation that maximizes efficiency. In practice, we’ve seen this strategy significantly reduce compute hours on large ETL flows – it’s a way of trimming the peaks so the baseline can be lower. Maximize utilization of a smaller warehouse for most work, and handle the outliers separately.
Even the best-tuned pipeline drifts. Snowflake provides the WAREHOUSE_METERING_HISTORY view, which logs how many credits each warehouse consumed and how busy it was. By looking at metrics like average concurrency or average load, you can identify warehouses that are over-provisioned (e.g, running as Large but only ever using 1-2 threads, meaning a Small would suffice) or under-provisioned (consistently queuing, maybe need multi-cluster or bigger size).
How to implement:
-- Show average concurrent threads for each warehouse over the past month
SELECT warehouse_name,
       AVG(average_running) AS avg_running_threads_pct
FROM   snowflake.account_usage.warehouse_metering_history
WHERE  start_time >= DATEADD(month, -1, CURRENT_TIMESTAMP())
GROUP  BY warehouse_name
ORDER  BY avg_running_threads_pct DESC;
Alternative:
If you prefer guardrails over dashboards, create a post-job script or governance policy that resets any warehouse larger than back to its baseline size once a task finishes. That way oversized settings never live past their moment of need.
Takeaway: Optimisation isn’t a one-off project—it’s a habit. A 10-minute, once-a-month utilisation query keeps warehouse sprawl in check and ensures you’re paying for the horsepower you actually use, not yesterday’s experiments.

Snowflake rarely explodes from a single bad query; bills creep up through thousands of small, well-meaning inefficiencies. By tackling the most wasteful behaviour in each workload before you dive into warehouse parameters, you’ll cut credits without throttling the very people who rely on the platform. Review, adjust, repeat.
.svg)
.svg)
.svg)
.png)

.svg)
.svg)
.svg)
.svg)
.svg)